研究目的
Investigating the effect of laser power and ablation time on the photoluminescence properties of colloidal graphene quantum dots synthesized through laser ablation of reduced graphene oxide solution.
研究成果
GQDs with an average diameter of 2.6±0.6 nm were successfully synthesized using Ti-Sapphire femtosecond laser ablation. The study demonstrated that both laser power and ablation time significantly affect the photoluminescence properties of the GQDs, indicating changes in their size, shape, or edge-type. Increasing ablation power and time also increased the absorbance intensity, suggesting higher GQDs concentration.
研究不足
The study does not explore the effect of other laser parameters such as wavelength or pulse duration on the synthesis of GQDs. Additionally, the interaction between the femtosecond laser and water, leading to oxygen-carbon group impurities, could affect the purity of the GQDs.
1:Experimental Design and Method Selection:
The study involved synthesizing colloidal graphene quantum dots (GQDs) from reduced graphene oxide (rGO) solution using a Ti-Sapphire femtosecond laser. The synthesis parameters varied were laser power (1 Watt and 1.7 Watt) and ablation time (20 minutes and 60 minutes).
2:7 Watt) and ablation time (20 minutes and 60 minutes).
Sample Selection and Data Sources:
2. Sample Selection and Data Sources: rGO solution was prepared from local graphene powder using a modified Hummer method and then reduced using hydrazine. The rGO solution was diluted to a concentration of 5 mg/ml.
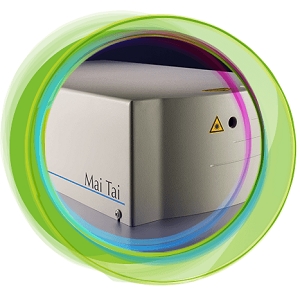
3:List of Experimental Equipment and Materials:
Ti-Sapphire femtosecond laser (Mai Tai? from Spectra-Physics), Ultraviolet-Visible (UV-Vis) spectrometer, Photoluminescence spectrometer, Transmission Electron Microscopy (TEM).
4:Experimental Procedures and Operational Workflow:
The rGO solution was ablated under different laser powers and ablation times. The optical properties of the resulting GQDs were analyzed using UV-Vis and photoluminescence spectroscopy. TEM was used to observe the morphology of the GQDs.
5:Data Analysis Methods:
The photoluminescence spectra were analyzed to observe changes in peak positions. TEM images were analyzed using ImageJ software to determine the size distribution of GQDs.
独家科研数据包��,助您复现前沿成果����,加速创新突破
获取完整内容